Bài 1
The diagrams below show how houses can be protected in areas which are prone to flooding.
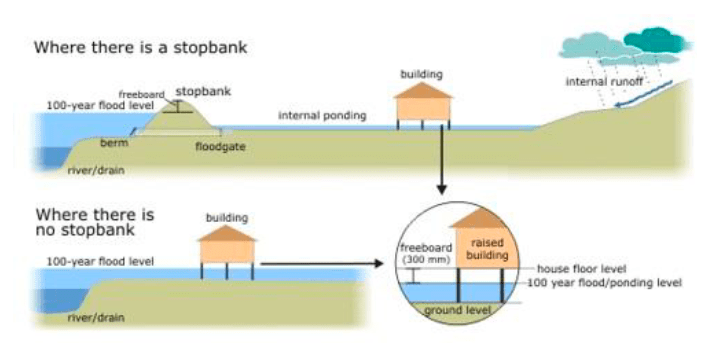
The diagrams compare two different methods of defence for homes which are at risk of being flooded.
The key difference between the diagrams is that they show flood protection with and without a stopbank. In either case, the at-risk home is raised on stilts above ground level.
The first diagram shows how a stopbank acts as a flood barrier to stop river water from flooding homes. The stopbank is a small mound of land next to the river that is higher than the 100-year flood level, and prevents the river from bursting its banks. Nearby houses can be built on stilts to prevent flooding from rainwater, and a floodgate beneath the stopbank can be opened to allow this ‘ponding’ to drain off into the river.
When there is no stopbank, as shown in the second diagram, there will be nothing to stop the river from flooding. In this case, the solution is to put buildings on stilts. The height of the stilts is measured so that the floor of the house is 300mm above the 100-year flood level. This measurement is called the ‘freeboard’.
Bài 2
The diagram below shows how solar panels can be used to provide electricity for domestic use.
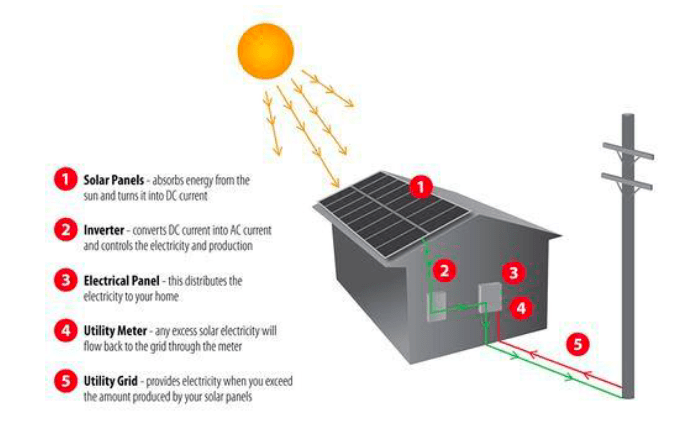
The picture illustrates the process of producing electricity in a home using solar panels.
It is clear that there are five distinct stages in this process, beginning with the capture of energy from sunlight. The final two steps show how domestic electricity is connected to the external power supply.
At the first stage in the process, solar panels on the roof of a normal house take energy from the sun and convert it into DC current. Next, this current is passed to an inverter, which changes it to AC current and regulates the supply of electricity. At stage three, electricity is supplied to the home from an electrical panel.
At the fourth step shown on the diagram, a utility meter in the home is responsible for sending any extra electric power outside the house into the grid. Finally, if the solar panels do not provide enough energy for the household, electricity will flow from the utility grid into the home through the meter.
Bài 3
The chart below shows the process of waste paper recycling.
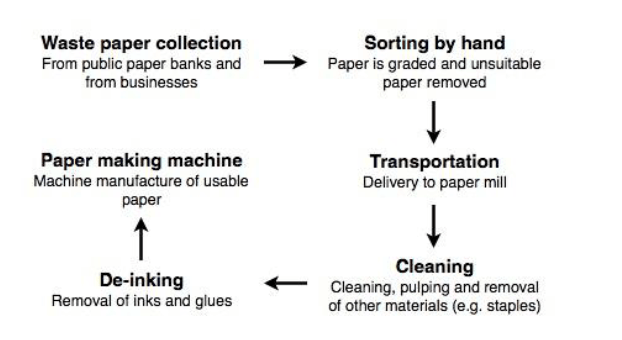
The flow chart shows how waste paper is recycled. It is clear that there are six distinct stages in this process, from the initial collection of waste paper to the eventual production of usable paper.
At the first stage in the paper recycling process, waste paper is collected either from paper banks, where members of the public leave their used paper, or directly from businesses. This paper is then sorted by hand and separated according to its grade, with any paper that is not suitable for recycling being removed. Next, the graded paper is transported to a paper mill.
Stages four and five of the process both involve cleaning. The paper is cleaned and pulped, and foreign objects such as staples are taken out. Following this, all remnants of ink and glue are removed from the paper at the de-inking stage. Finally, the pulp can be processed in a paper making machine, which makes the end product: usable paper.
(160 words, band 9)
Bài 4
The diagram shows the life cycle of the honey bee.
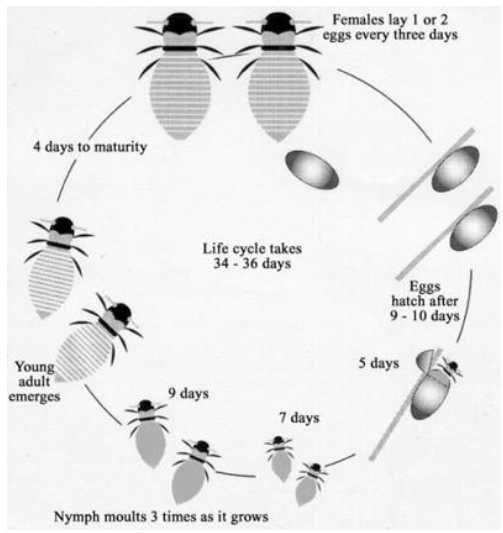
The diagram illustrates the various stages in the life of a honey bee. We can see that the complete life cycle lasts between 34 and 36 days. It is also noticeable that there are five main stages in the development of the honey bee, from egg to mature adult insect.
The life cycle of the honey bee begins when the female adult lays an egg; the female typically lays one or two eggs every 3 days. Between 9 and 10 days later, each egg hatches and the immature insect, or nymph, appears.
During the third stage of the life cycle, the nymph grows in size and sheds its skin three times. This moulting first takes place 5 days after the egg hatches, then 7 days later, and again another 9 days later. After a total of 30 to 31 days from the start of the cycle, the young adult honey bee emerges from its final moulting stage, and in the space of only 4 days it reaches full maturity.
(169 words, band 9)
Bài 5
The diagrams below show some principles of house design for cool and for warm climates.
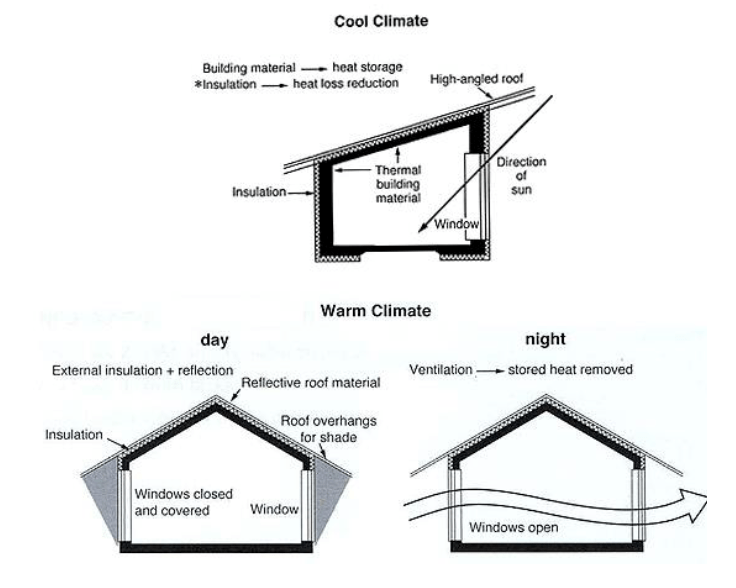
The diagrams show how house designs differ according to climate.
The most noticeable difference between houses designed for cool and warm climates is in the shape of the roof. The designs also differ with regard to the windows and the use of insulation.
We can see that the cool climate house has a high-angled roof, which allows sunlight to enter through the window. By contrast, the roof of the warm climate house has a peak in the middle and roof overhangs to shade the windows. Insulation and thermal building materials are used in cool climates to reduce heat loss, whereas insulation and reflective materials are used to keep the heat out in warm climates.
Finally, the cool climate house has one window which faces the direction of the sun, while the warm climate house has windows on two sides which are shaded from the sun. By opening the two windows at night, the house designed for warm climates can be ventilated.
(162 words, band 9)
Bài 6
The diagram below shows the water cycle, which is the continuous movement of water on, above and below the surface of the Earth.
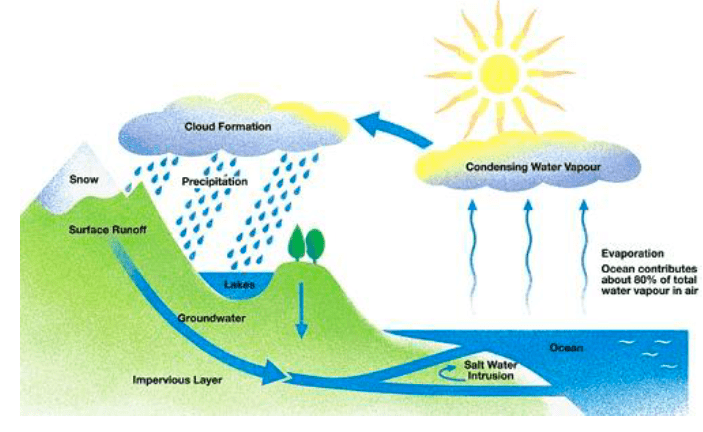
The picture illustrates the way in which water passes from ocean to air to land during the natural process known as the water cycle.
Three main stages are shown on the diagram. Ocean water evaporates, falls as rain, and eventually runs back into the oceans again.
Beginning at the evaporation stage, we can see that 80% of water vapour in the air comes from the oceans. Heat from the sun causes water to evaporate, and water vapour condenses to form clouds. At the second stage, labelled ‘precipitation’ on the diagram, water falls as rain or snow.
At the third stage in the cycle, rainwater may take various paths. Some of it may fall into lakes or return to the oceans via ‘surface runoff’. Otherwise, rainwater may filter through the ground, reaching the impervious layer of the earth. Salt water intrusion is shown to take place just before groundwater passes into the oceans to complete the cycle.
(156 words, band 9)
Bài 7
The diagram below shows how the Australian Bureau of Meteorology collects up-to-the-minute information on the weather in order to produce reliable forecasts.
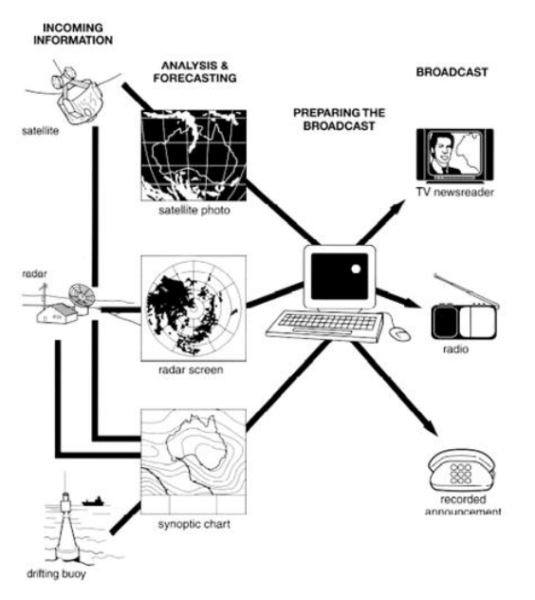
The figure illustrates the process used by the Australian Bureau of Meteorology to forecast the weather.
There are four stages in the process, beginning with the collection of information about the weather. This information is then analysed, prepared for presentation, and finally broadcast to the public.
Looking at the first and second stages of the process, there are three ways of collecting weather data and three ways of analysing it. Firstly, incoming information can be received by satellite and presented for analysis as a satellite photo. The same data can also be passed to a radar station and presented on a radar screen or synoptic chart. Secondly, incoming information may be collected directly by radar and analysed on a radar screen or synoptic chart. Finally, drifting buoys also receive data which can be shown on a synoptic chart.
At the third stage of the process, the weather broadcast is prepared on computers. Finally, it is delivered to the public on television, on the radio, or as a recorded telephone announcement.
Bài 8
The diagram below shows the life cycle of a salmon, from egg to adult fish.
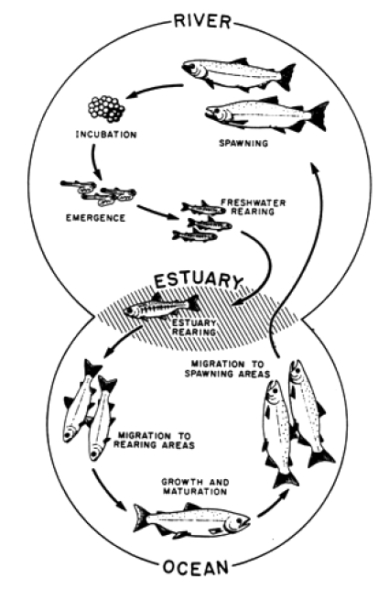
The diagram illustrates the stages in the life of the salmon, from birth to maturity.
It is clear that there are six* main stages as the salmon develops from egg to mature adult. We can also see that salmon spend time in three distinct locations during the cycle, moving from river to estuary to ocean and then back upstream.
Salmon begin their lives in rivers where the adult fish lay and incubate their eggs. After emerging from eggs, the young salmon spend the next stage of their lives being reared in freshwater areas. Then, at some point in their development, the fish swim downstream to river estuaries where rearing continues.
Following the estuary rearing period, the maturing salmon migrate to the ocean, where they eventually become fully grown adults. Finally, the adult fish travel back upstream to spawning areas of rivers; here they reproduce and lay their eggs, and the life cycle begins anew.
(154 words, band 9)
Tham khảo thêm các bài viết band 9 Writing Task 1 chủ đề Bar Chart
Tham khảo thêm các bài viết band 9 Writing Task 1 chủ đề Pie Chart
Đăng ký làm kiểm tra đầu vào miễn phí cho các lớp học IELTS tại VietAccepted